MetaServer > Help > How to collect MetaServer performance data
How to collect MetaServer performance data with Windows Performance Monitor
01 Introduction
You can use Windows Performance Monitor (= PerfMon) to monitor resource usage and server processes. Use PerfMon to gather detailed performance information, including how often the CPU is being used, how much memory is being used and information about each MetaServer process.
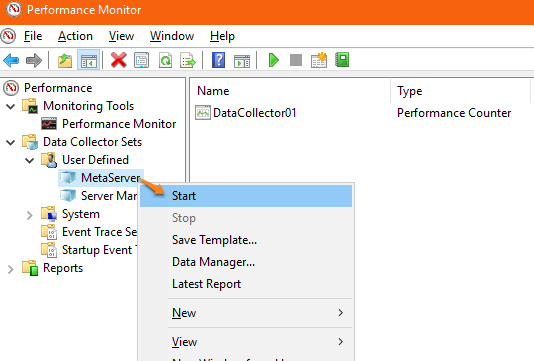
Before you can use PerfMon, you set up a data collector set. This is how PerfMon stores the data that it collects. To collect information about MetaServer processes with PerfMon, the MetaServer service must be running when you create the data collector set.
The data that you collect in PerfMon are referred to as “performance counters”.
Step 1) Search for Windows’ Performance Monitor in your Windows Start menu. You can also find this in your “Windows Administrative Tools” folder.
Right-click on the “Performance Monitor” and run as an administrator.
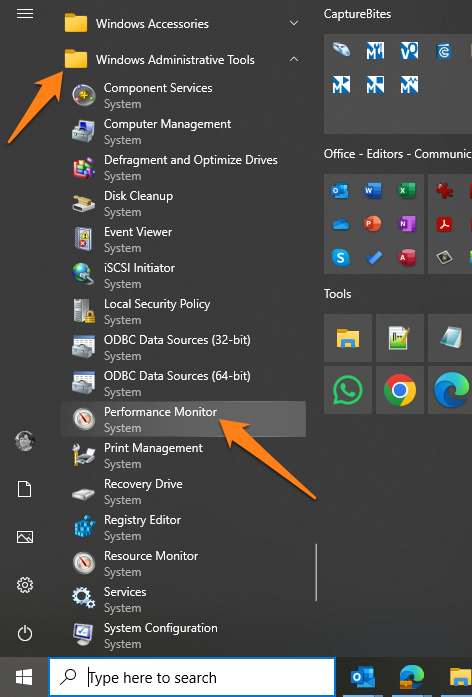
Step 2) In the left pane of your Performance Monitor window, click “Data Collector Sets”.
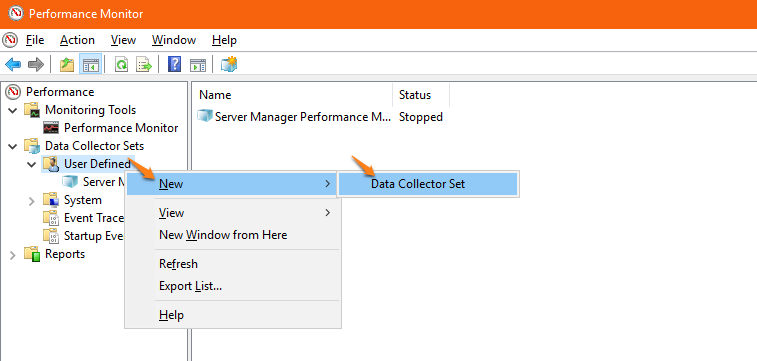
Right-click on “User Defined” and select “New” -> “Data Collector Set”.
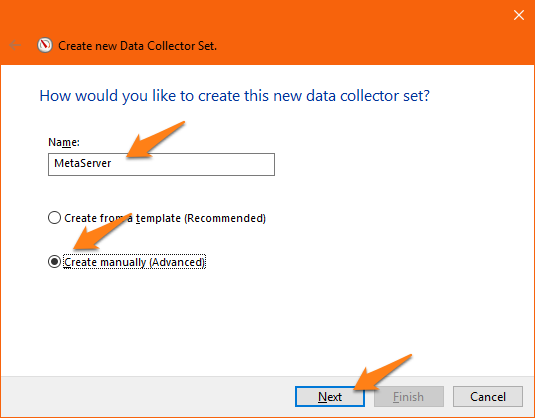
Step 3) The “Create new Data Collector Set” Wizard opens.
Add a name for your Data Collector Set, e.g. “MetaServer, and select “Create manually (Advanced)”.
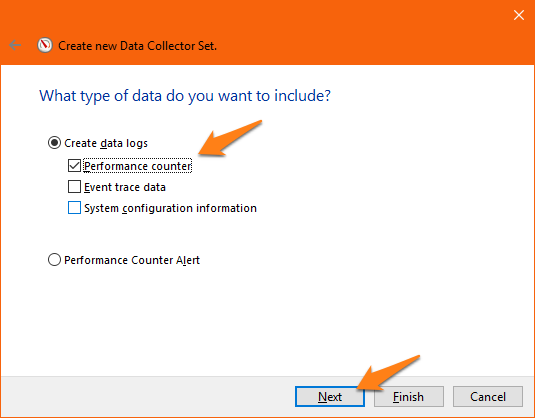
Step 4) Select “Performance counter” as your “Create data logs” option. Press “Next” to adjust the remaining settings.
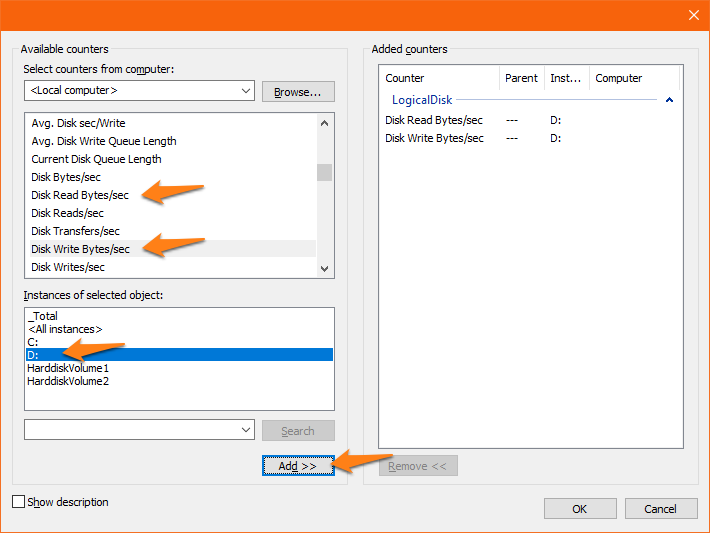
Step 1) In the below screenshot, you can find an example on how to add the “Disk Read” and “Disk Write” performance counters to our Data Collector Set.
– Select the available counter
– Select the instance where you want to apply the counter (e.g. a specific hard disk, a service, etc.)
– Add to the counters list
You can add any other performance counters using the same method.
The below screenshot shows another example where performance counters are added specific to the “MetaService” process:
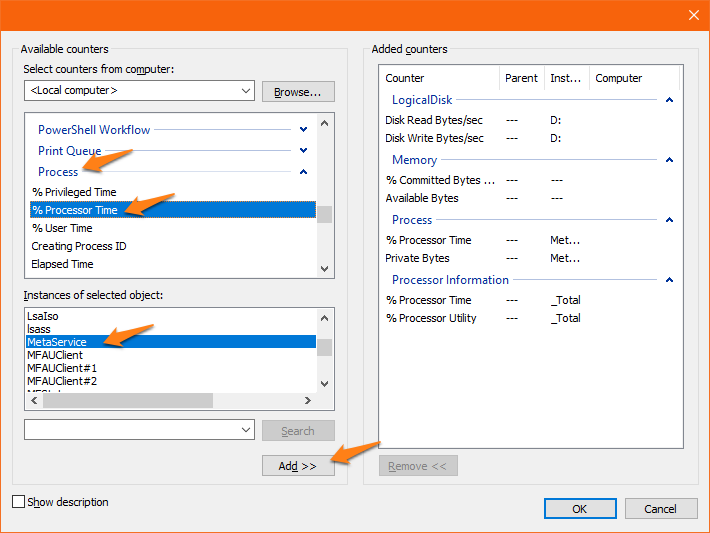
Here, the following performance counters were selected:
| Category | Performance Counters | Notes |
|---|---|---|
| Logical Disk | Disk Read Bytes/sec | The amount of bytes read to the server’s hard disk. Select these counters for the disk on the MetaServer data drive (by default, this is the “C” drive). |
| Logical Disk | Disk Write Bytes/sec | The amount of bytes written to the server’s hard disk. Select these counters for the disk on the MetaServer data drive (by default, this is the “C” drive). |
| Memory | % Committed Bytes in Use | The percentage of virtual memory in use. |
| Memory | Available MBytes | The amount of memory available in megabytes. |
| Process | % Processor Time | The percentage of processing capacity being used by the MetaServer service called “Metaservice”. |
| Process | Private Bytes | The amount of memory reserved for the MetaServer service, called “Metaservice”. |
| Processor Information | % Processor Time | The percentage of time that the processor spends active by the processor. |
| Processor Information | % Processor Utility | The percentage of processing capacity being used by the processor. |
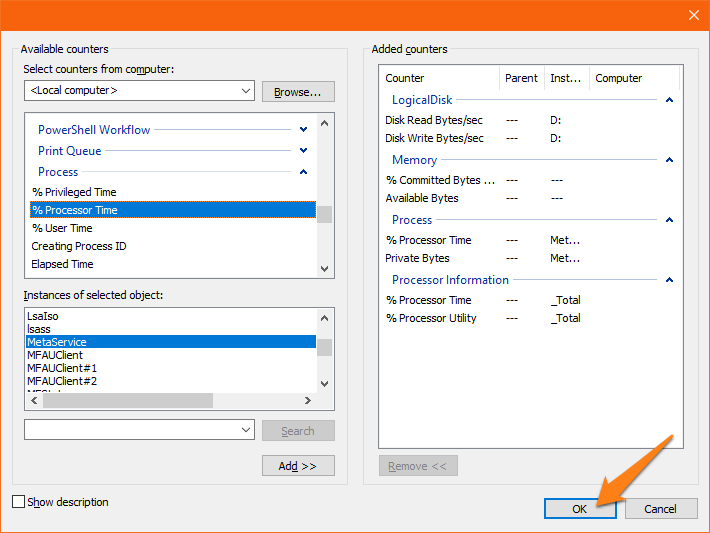
Step 2) When you have finished selecting your counters, press “OK”.
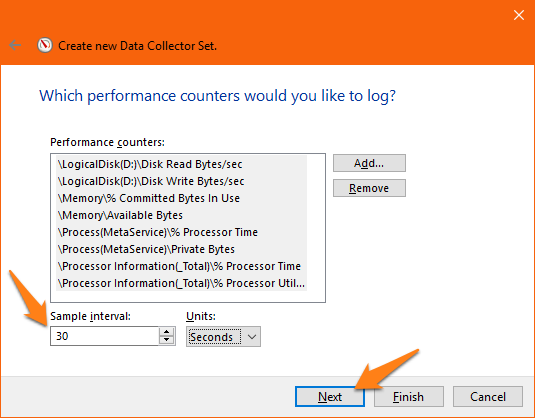
Step 3) You can see the list of your selected performance counters and you can adjust the interval when these counters are applied.
We recommend setting the interval time to 30 seconds.
Press “Next”.
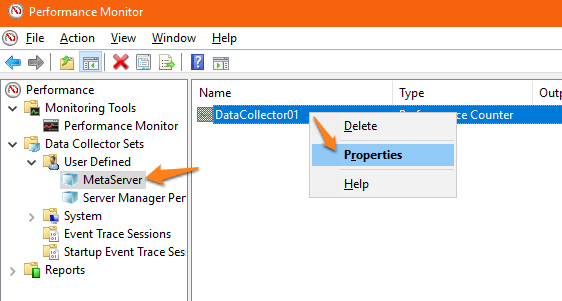
Step 1) Select the data collector set you’ve just created (e.g. “MetaServer”) in the left pane of the Performance Monitor window.
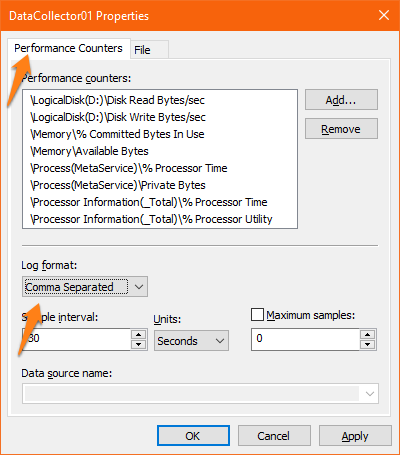
In the right pane, right-click the performance counter called “DataCollector01” and select “Properties”.
Step 2) In the “Performance Counters” tab, select “Comma Separated” as the log format.
You can also adjust the sample interval, if required. We recommend keeping it 30 seconds.
Click “OK”.
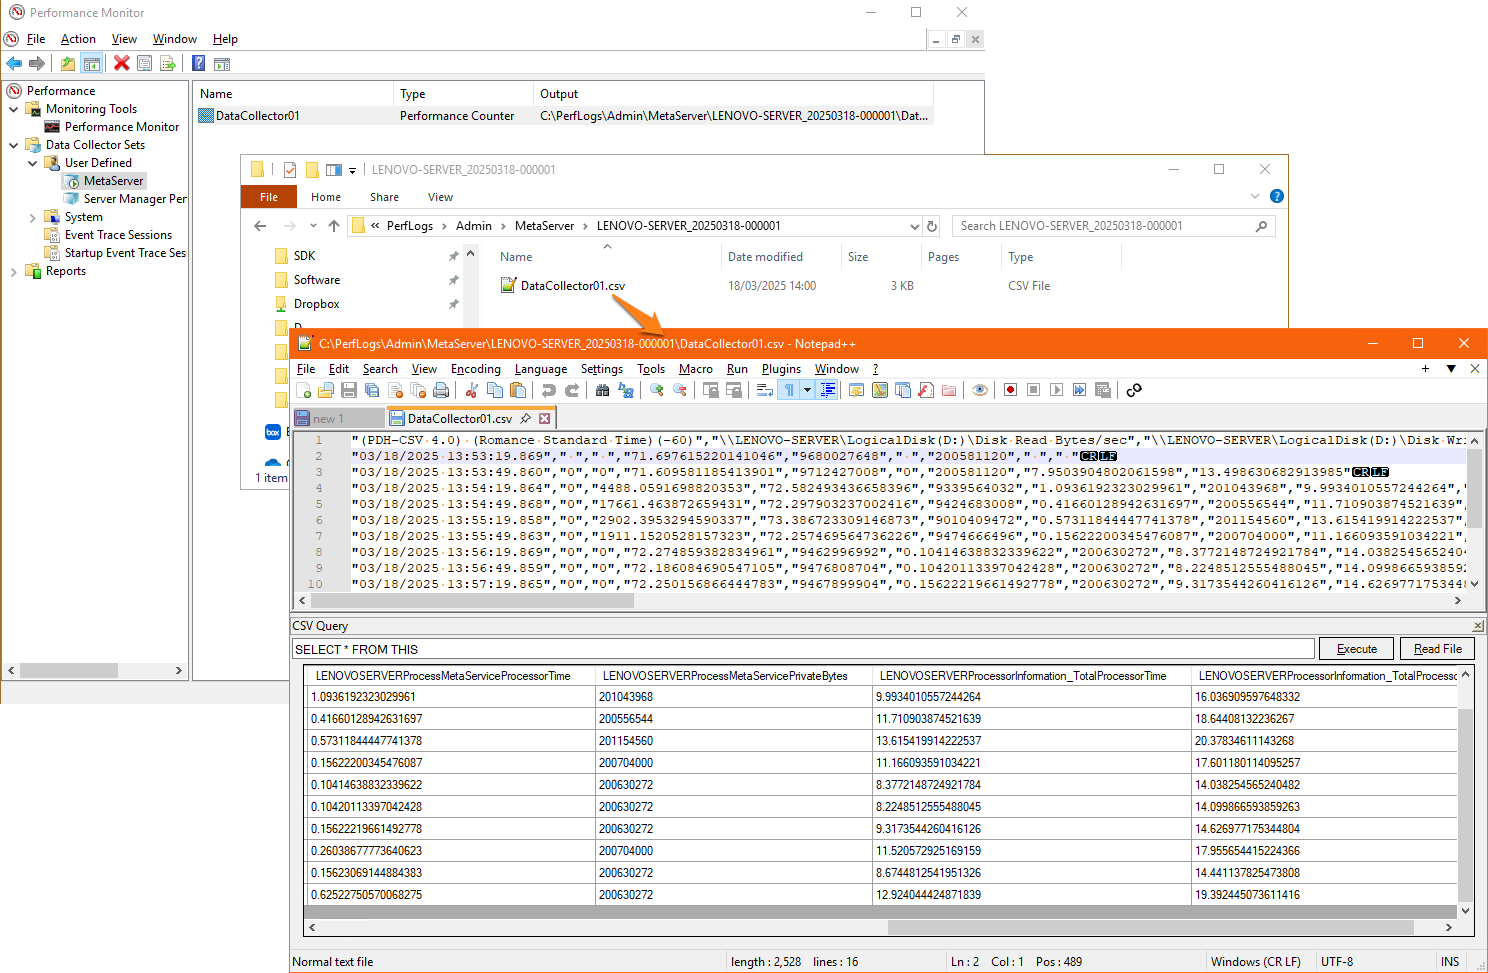
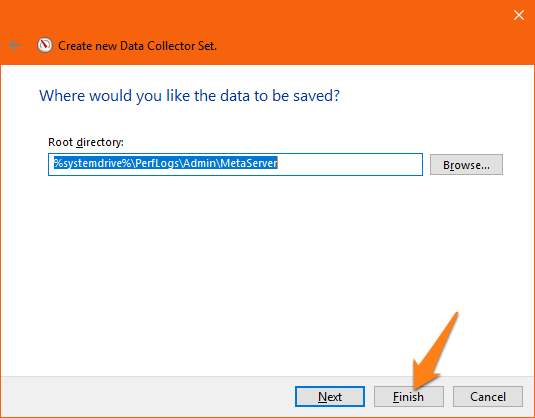
You can now navigate to your Data Collector Set CSV file. If you used our default path, this should be:
%systemdrive%\PerfLogs\Admin\MetaServer
You can open the CSV with, for example, NotePad++.
IMPORTANT: Opening your CSV with Excel will lock it and PerfMon won’t be able to write to the file anymore until it’s closed again.
If anything unusual occurs with the MetaServer service, please share this Data Collector Set CSV file with us to help us solve your issue faster.
